
The Ultimate Body Fat Guide: Visual Comparison (10-40%) & Ideal Ranges for Men & Women
What do 10%, 20%, or 30% body fat look like? This guide provides the ultimate visual comparison for men and women. Discover your ideal range for health and muscle gain, the risks of low body fat, and how to measure your progress accurately without unreliable scales.
You train hard, eat clean, but the mirror and the scale are telling two different stories. Welcome to the club. The problem is: the number on the scale doesn't tell you what your weight actually consists of. A 90 kg athlete packed with muscle looks completely different than a 90 kg office worker with zero training experience.
The deciding factor for your look—whether you're "ripped," "athletic," or "soft"—is your body fat percentage (BFP). But percentages are abstract. What does 15% body fat actually look like? And at what point does it become a health risk?
In this ultimate guide, we take a look at a full visual comparison across 7 stages—from extremely shredded to obesity. We also dive deep into the science: Why do men and women differ? When does a low BFP become dangerous? And where is the "sweet spot" for building muscle?
The Biological Difference: Why Men and Women Function Differently
Before we look at the different levels, we need to clear up a fundamental misunderstanding: A man with 15% BFP is "lean," while a woman with 15% is "extremely defined." Why?
The female body is biologically programmed to store more fat. This is due to what is known as essential body fat. This fat isn't "bad"; it's vital for survival. It is required for hormone production (especially estrogen), maintaining the menstrual cycle, and as an energy reserve for potential pregnancy.
- Essential fat mass for men: approx. 2–5%
- Essential fat mass for women: approx. 10–13%
The rule of thumb: Due to physiological factors, to achieve roughly the same level of "hardness" or definition, a woman's BFP is typically about 7 to 9 percentage points higher than a man's. A man with 10% BFP (highly defined) visually corresponds to a woman with roughly 17-19% BFP (very athletic).
The Lower "Red Zone": When is Body Fat Too Low?
In the fitness world, it’s often suggested that "lower is always better." This is false and potentially dangerous.
When BFP falls below essential levels, the body enters emergency mode (RED-S: Relative Energy Deficiency in Sport). It starts conserving energy by shutting down non-essential functions.
Specific Problems:
- For women (often below 15-16%): Amenorrhea (loss of period), hormonal imbalances, loss of bone density (risk of osteoporosis).
- For men (often below 5-6%): Crashing testosterone levels, loss of libido.
- For both: Chronic fatigue, constantly feeling cold, weakened immune system, psychological stress, and constant hunger.
The "Sweet Spot": Optimal BFP for Muscle Growth
To build muscle effectively, the body usually requires a slight calorie surplus. Those who start out too lean often fear eating enough to grow. Those who start with a BFP that is too high often gain a disproportionate amount of fat during a surplus.
The ideal starting range for a building phase (bulking) is often here:
- For men: Start between 10% and 15% BFP. Bulk up to a maximum of 18-20%.
- For women: Start between 18% and 23% BFP. Bulk up to a maximum of 26-28%.
In these ranges, the hormonal environment is usually anabolic (conducive to growth) and you feel fit and energized.
The Ultimate Visual Guide: 7 Levels of Body Fat
Note: The following descriptions are general guidelines. Existing muscle mass and genetic fat distribution significantly influence individual appearance.
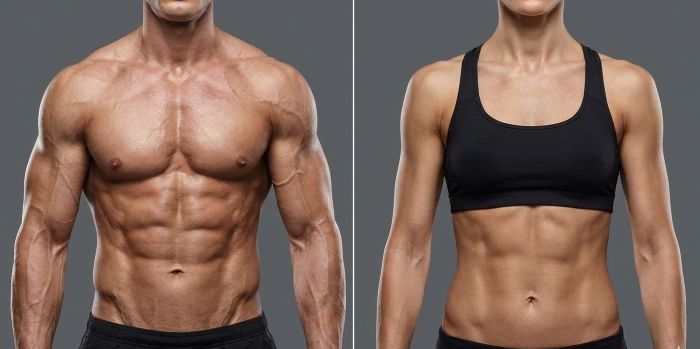
Level 1: The "Ripped" Look (Highly Defined)
Range: approx. 8-10% (M) | approx. 16-18% (F)
- Men: Extremely defined. Six-pack clearly visible without flexing. Vascularity (veins) visible on arms/shoulders. Difficult to maintain long-term.
- Women: Very athletic and tight. Flat stomach with visible muscle outlines ("lines"). A look that requires significant discipline.
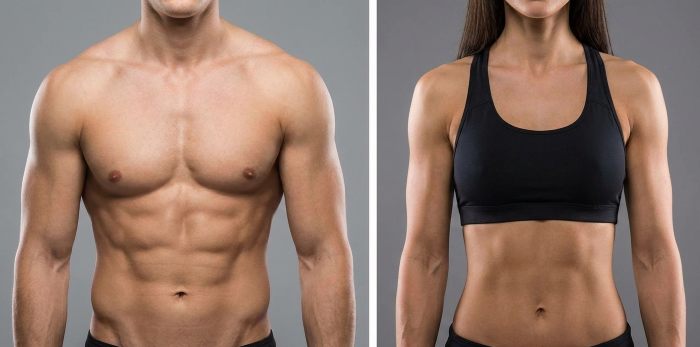
Level 2: The Athletic "Beach Body"
Range: approx. 13-15% (M) | approx. 21-23% (F)
- Men: Athletic and fit. Upper abs visible in good lighting, but no "hard" six-pack. Good definition in arms/chest. A sustainable look.
- Women: Very lean and fit. Flat stomach, light muscle definition in arms and legs. A very popular and healthy range.
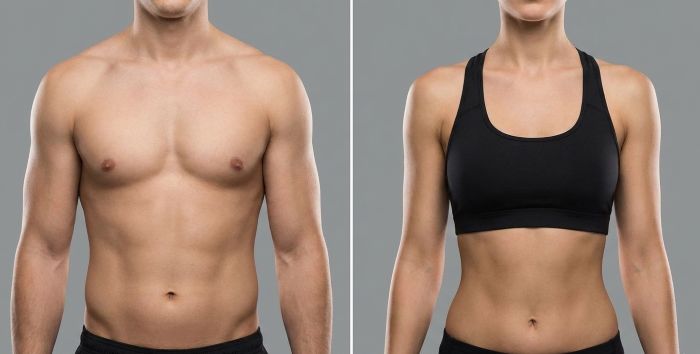
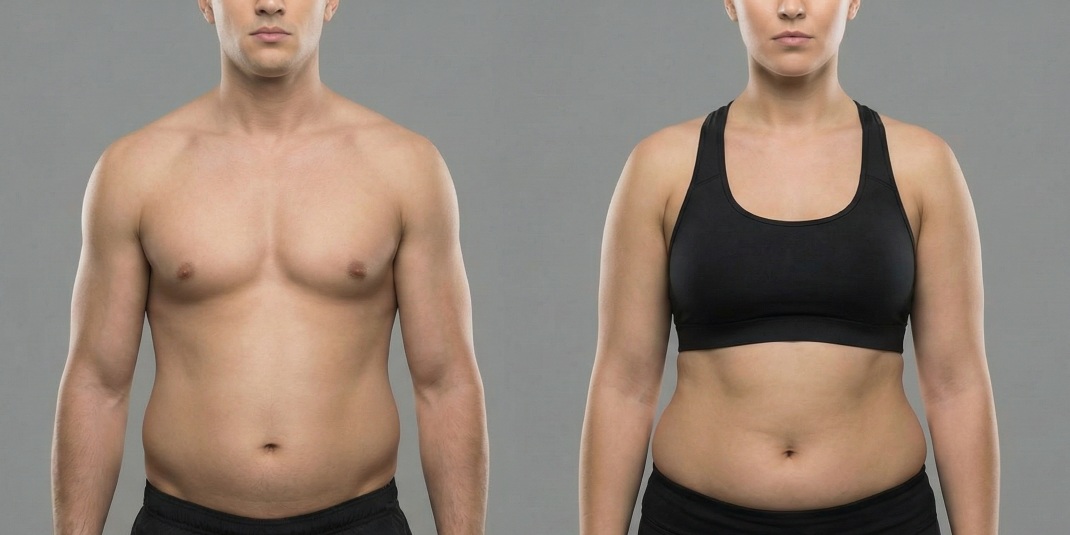
Level 3: Healthy Average
Range: approx. 18-20% (M) | approx. 26-28% (F)
- Men: Healthy range. No visible abdominal muscles; the midsection is softer. With muscle underneath, you look "big" without being "fat."
- Women: Healthy, fit range. Feminine curves are present, the body is firm but without sharp muscle separation.
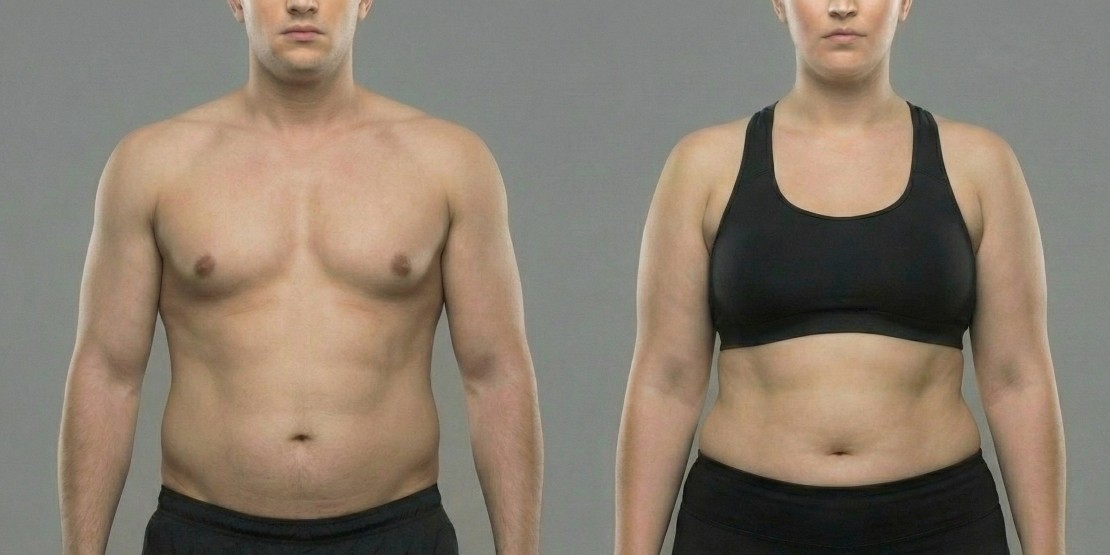
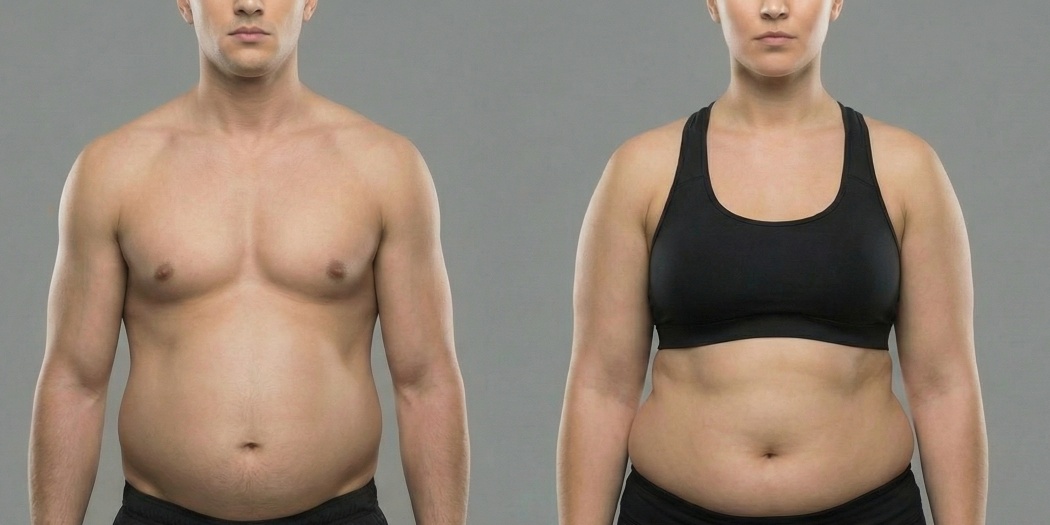
Level 4: Early Overweight
Range: approx. 25% (M) | approx. 30-33% (F)
- Men: The waistline becomes noticeably rounder ("love handles"). No muscle definition is visible in the abdominal area. The chest area becomes softer.
- Women: Curves are more pronounced, with more softness visible on the hips, thighs, and arms. This is the upper end of "average."
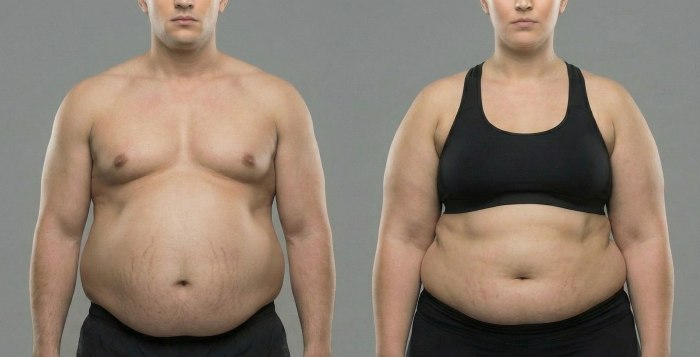
Level 5: Clearly Overweight
Range: approx. 30% (M) | approx. 35-38% (F)
- Men: Protruding abdomen; the waist is often wider than the hips. The face appears rounder. Risk of increased visceral fat (fat around the organs).
- Women: The figure is fuller overall, with significant fat deposits on the abdomen, hips, and thighs. The waist is less defined.
Level 6: Grade I Obesity
Range: approx. 35% (M) | approx. 40% (F)
- Men: Significant waist circumference. The entire body contour is round and soft. Medically, this is now classified as obesity.
- Women: Very full figure with pronounced curves across the entire body. Significant fat deposits on arms and legs.
Level 7: Grade II Obesity
Range: approx. 40%+ (M) | approx. 45%+ (F)
- Men: Very prominent abdomen. Visible skin folds form. Mobility may be restricted. High health risk.
- Women: Fat is distributed across the entire body. There are clear skin folds, especially on the abdomen and back. High health risk.
The Risks of the Upper "Red Zone"
While a BFP that is too low represents an acute stress problem, a permanently high BFP (from Level 5 upwards) is a creeping risk. The primary issue is often visceral fat, which wraps around the organs and promotes inflammation. The risk for insulin resistance (Type 2 diabetes), cardiovascular disease, and joint problems increases massively in these ranges.
How Do I Determine My Own BFP? (And Why Scales Lie)
Now that you've seen the 7 levels, you're probably wondering: "Where do I stand?"
Using a standard body fat scale is often a frustrating experience. These devices rely on bioelectrical impedance analysis (BIA), which is highly sensitive to fluctuations in water balance. A salty dinner can completely skew the results the following morning.
The Solution: Visual Analysis with the Coach Milo App
This is where modern technology comes into play. The Coach Milo App utilizes advanced AI to analyze your body fat percentage based on photos. This is often more accurate than budget scales, as the AI learns to identify visual markers such as muscle definition, shadows, and proportions instead of being fooled by water retention.
With the app's built-in body fat analysis, you have an objective tool right in your pocket to track your true progress and accurately place yourself within the 7 levels.
In Summary
Body fat percentage is the most vital tool for managing your physique and a key indicator of your overall health. The images and figures in this guide are intended as a reference.
Avoid extremes. Neither the constant state of depletion in Level 1 nor the health risks starting at Level 5 are worth pursuing. Find the range (typically Level 2 or 3) where you feel powerful, healthy, and confident—and use smart tools like the Coach Milo App to track your path there.
Ready to get started?
Download Coach Milo now and reach your fitness goals with AI support!